
The city of Charlotte ranks dead last (50th out of 50) among America’s largest cities in Upward Mobility. This means that for a child born in poverty in Charlotte, it is harder to get out of poverty than any other large city in the United States. Below is an overview of the five major research components that make up the Upward Mobility Study.
The chasm between rich and poor in Charlotte is so wide, Charlotte has been referred to as the “Tale of Two Cities: the City of Poverty, and the City of Prosperity.” Concentrated areas of poverty are a key indicator of low community economic mobility.
(Data source: U.S. Census Bureau, 2013 American Community Survey)

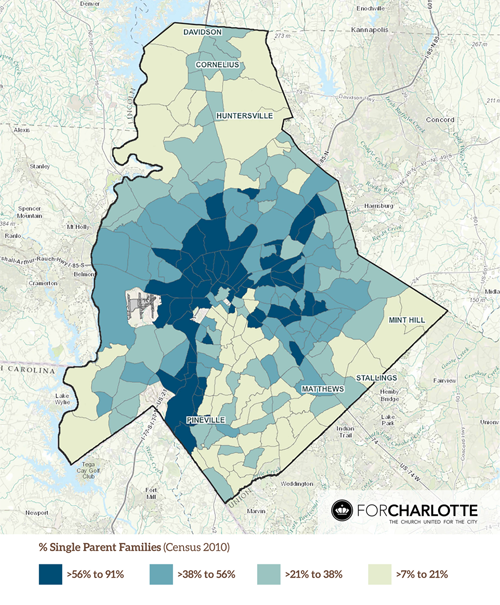
The breakdown of the family leads to many societal injustices; such as domestic violence, human trafficking, and foster & adoption needs. Below is one way For Charlotte is engaging this need.
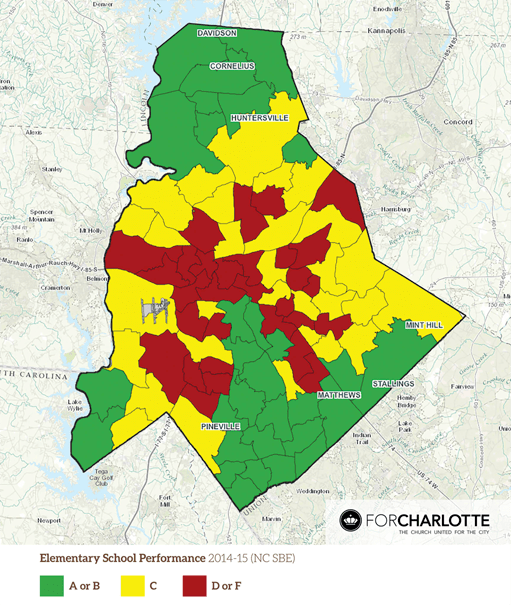
Students who read on grade level by third grade are 96% more likely to graduate high school, a key economic mobility indicator. Currently, only 39% of CMS third graders are reading on grade level.
(Data source: North Carolina Department of Instruction, 2012-13)
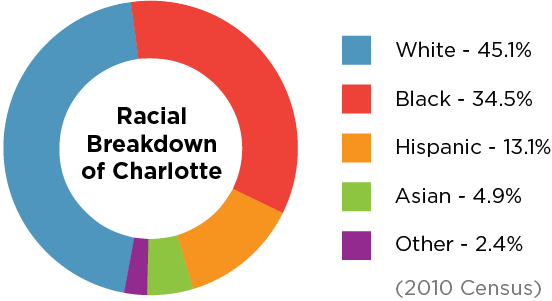
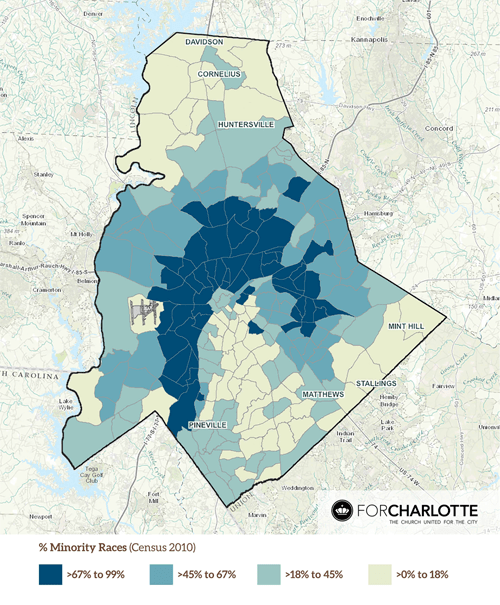
Charlotte is geographically divided by race and ethnicity as you can see on the map to the right. High levels of segregation are directly correlated to low levels of community economic mobility.
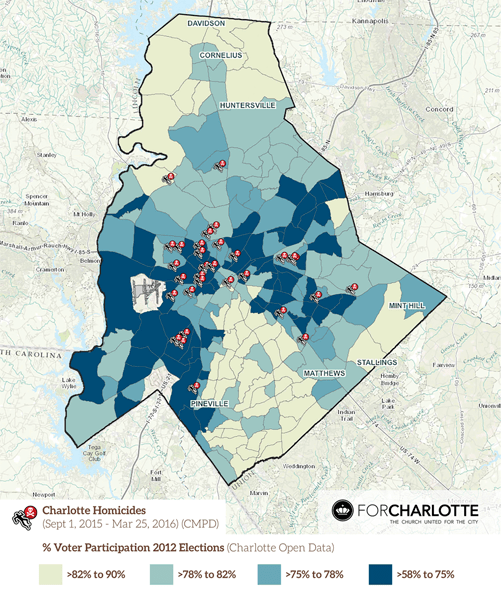
Social Capital measures the level of trust between people, people groups, or races. It is the glue that holds society together. Both voter participation and crime rates are key indicators of community connectedness and social capital. When communities don’t turn out to vote or feel safe, they have a low level of social capital. Lower social capital is directly associated with lower economic mobility.
![]()
"*" indicates required fields
